
Page 13 - Adobe ILLustrator
P. 13
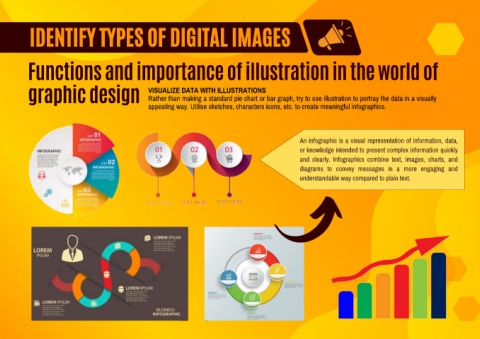
IDENTIFY TYPES OF DIGITAL IMAGES


           Functions and importance of illustration in the world of


           graphic design                            VISUALIZE DATA WITH ILLUSTRATIONS

                                                     Rather than making a standard pie chart or bar graph, try to use illustration to portray the data in a visually
                                                     appealing way. Utilise sketches, characters icons, etc. to create meaningful infographics.


                                                                                                          An infographic is a visual representation of information, data,
                                                                                                          or knowledge intended to present complex information quickly
                                                                                                          and  clearly.  Infographics  combine  text,  images,  charts,  and
                                                                                                          diagrams  to  convey  messages  in  a  more  engaging  and
                                                                                                          understandable way compared to plain text.