
Page 293 - MATERIAL SCIENCE AND ENGINEERING PART 1
P. 293
Equilibrium phase 1 2 3
2
diagram
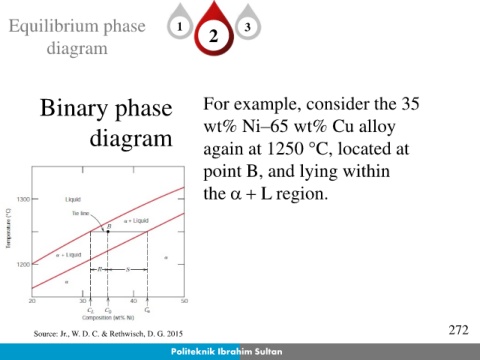
Binary phase For example, consider the 35
diagram wt% Ni–65 wt% Cu alloy
again at 1250 C, located at
point B, and lying within
the + L region.
272
Source: Jr., W. D. C. & Rethwisch, D. G. 2015
Politeknik Ibrahim Sultan