
Page 33 - BASIC CONCEPTUAL OF THERMOFLUID
P. 33
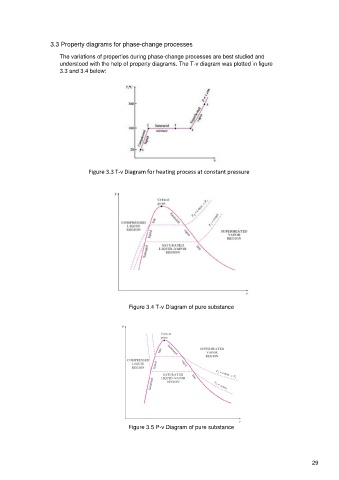
3.3 Property diagrams for phase-change processes

                      The variations of properties during phase-change processes are best studied and
                      understood with the help of property diagrams. The T-v diagram was plotted in figure
                      3.3 and 3.4 below:


                                Figure 3.3 T-v Diagram for heating process at constant pressure


                                              Figure 3.4 T-v Diagram of pure substance


                                              Figure 3.5 P-v Diagram of pure substance


                                                                                                               29