
Page 282 - MATERIAL SCIENCE AND ENGINEERING PART 1
P. 282
Equilibrium phase 1 2 3
2
diagram
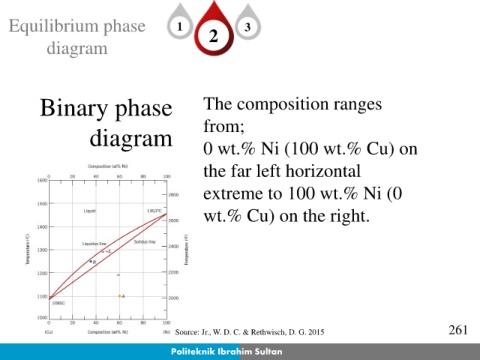
Binary phase The composition ranges
diagram from;
0 wt.% Ni (100 wt.% Cu) on
the far left horizontal
extreme to 100 wt.% Ni (0
wt.% Cu) on the right.
Source: Jr., W. D. C. & Rethwisch, D. G. 2015 261
Politeknik Ibrahim Sultan